

Price History that shows how a product really moved over time
Our Price History system shows how product prices changed over the last 6 months through a clean chart and quick summary blocks directly on the product page.
What this system does
Price History was built to make product pricing more transparent. Instead of only seeing the current live price, customers can also view how a product price changed over time inside a dedicated product page tab.
You can quickly review the current price, the lowest and highest recorded prices, and short-term movement over the last 24 hours, last week and last month.
What appears in the Price History tab
A visual 6-month trend
Each supported product includes a clean chart that shows the recorded price path across the last 6 months.
Current, lowest and highest
Above the chart you can immediately see the current recorded price together with the lowest and highest points in the retained period.
24H, week and month change
The tab also shows short-term change indicators so you can quickly understand whether the product moved recently or stayed stable.
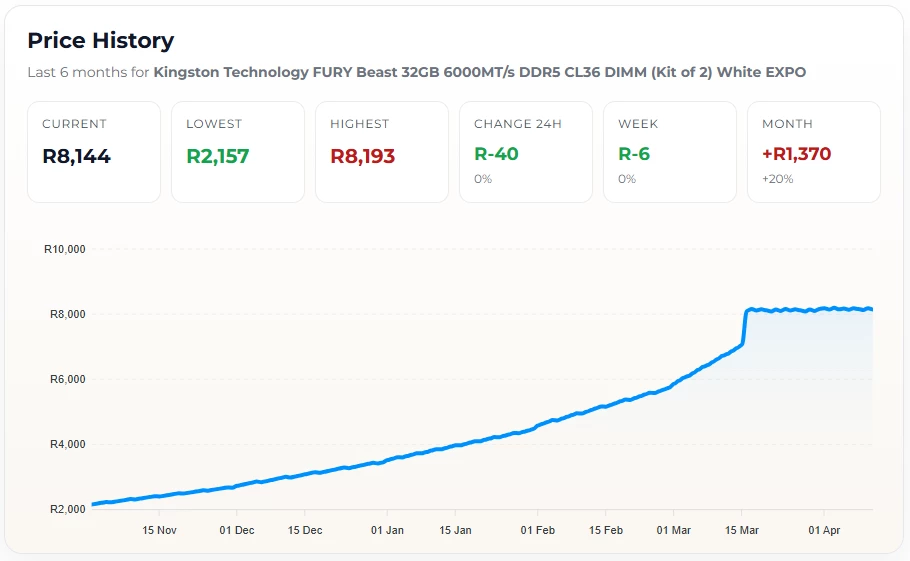
The Price History tab shows a 6-month visual chart together with quick pricing statistics, helping customers understand both long-term movement and recent change.
Why this is useful
A single live price shows where the product is now, but it does not show whether that price is stable, rising or recently changed.
Price History gives context. You can see whether the product climbed steadily, moved sharply, or stayed near the same level for weeks.
That makes it easier to judge whether you want to buy now, keep watching, or compare the movement against similar products.
What the summary means
Current shows the latest recorded price. Lowest and Highest show the main range within the last 6 months.
Change 24H, Change Week and Change Month compare the latest value against earlier recorded points.
This gives you both the broad trend and the recent direction without needing to read every point on the chart.
System rules at a glance
Designed to be readable fast
The graph and summary blocks were designed to make price movement readable in seconds, even for first-time visitors.
Controlled storage
Because data is written once per day and rotated automatically after 6 months, the feature stays practical without uncontrolled long-term growth.
More context before purchase
Customers can review whether a product price is trending upward, stabilizing, or recently changed instead of relying only on a single current value.
Important note
Price History is designed to show recorded historical movement, not to guarantee future pricing. Prices can continue changing after the latest stored point.
The chart should be read as a historical reference tool, while the live product page remains the final source for the current real-time selling price and availability.
A clearer way to understand product pricing
Open a supported product, switch to the Price History tab, and review how the price moved across the last 6 months with a clean visual trend and quick summary metrics.